


Silver price today just breached $35 per ounce. While gold grabs headlines, silver is the stealth rocket-and the gold-silver ratio just hit 160:1, a divergence that historically precedes violent silver outperformance.
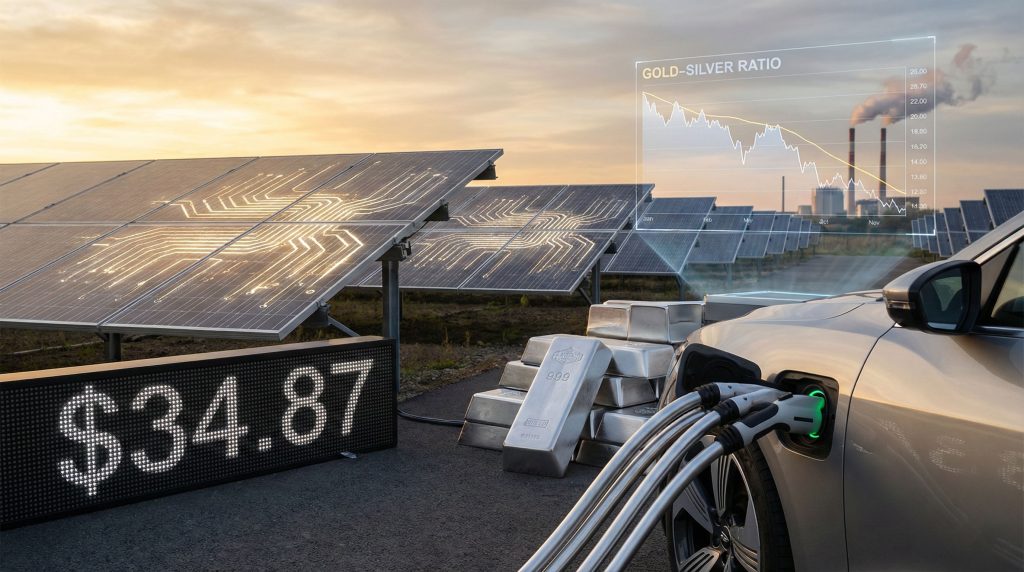
The industrial metal is having its revenge. Solar panel demand is devouring supply. Electric vehicles use 2-3 kilograms per car. 5G infrastructure requires silver conductive paste. Meanwhile, investment demand is accelerating as the Reddit crowd discovers the “poor man’s gold” is actually the rich man’s asymmetric bet.
This is what happens when 5,000 years of monetary history collides with 21st century technology.
Silver Price Today: The Numbers That Matter
- Current Spot Price: $34.87/oz
- January 2026 Performance: +12% (outperforming gold’s +5%)
- 52-Week High: $35.12 (January 29, 2026)
- Gold-Silver Ratio: 160:1 (Historical average: 50-60:1)
- Implied Fair Value: $92/oz (if ratio normalizes to 60:1)
The silver price today reflects a market in transition. From monetary metal to industrial critical mineral. From jewelry drawers to solar farms. The divergence between gold and silver ratios suggests either gold is overvalued, silver is catastrophically undervalued, or both.
Why Silver Is Exploding: Four Structural Drivers
1. Industrial Demand: The Solar Tsunami
Silver is the best electrical conductor on Earth. Full stop. This makes it irreplaceable in photovoltaic cells-each solar panel uses 20 grams of silver. With global solar installations hitting 400 GW annually, that’s 8,000 tonnes of silver demand per year from solar alone.
The math is brutal: total silver mine supply is ~25,000 tonnes annually. Solar now consumes 32% of all silver production. By 2027, some analysts project solar will absorb 50%+ of supply, creating a structural deficit regardless of investment demand.
Silver price today doesn’t reflect this squeeze because the market still treats it as a precious metal derivative. It’s not. It’s a critical industrial input with 5,000-year-old monetary pedigree.
2. Electric Vehicle Revolution: 2.3 kg Per Car
Internal combustion engines use virtually no silver. Electric vehicles? 2.3 kilograms average. The Silver Institute projects automotive silver demand will triple by 2030, from 2,000 tonnes to 6,000+ tonnes annually.
Tesla’s Cybertruck alone uses an estimated 15 kg of silver in its electrical systems. With EV adoption accelerating globally, the silver price today is pricing in scarcity that hasn’t fully materialized-but will.
3. Gold-Silver Ratio: The 160:1 Anomaly
Historically, the gold-silver ratio averages 50-60:1. Below 30:1 suggests silver overvaluation; above 80:1 signals extreme undervaluation. Today? 160:1.
This ratio has only been this extreme four times in history:
• 2020 COVID crash: Ratio hit 125:1, silver then rallied 140% in 12 months
• 1991 recession: Ratio hit 100:1, silver outperformed gold 3:1 over next decade
• 1980 Hunt Brothers peak: Ratio hit 17:1 (silver overvalued), then collapsed
• 2026 (Now): 160:1-a historical outlier
The silver price today suggests a mean reversion to 60:1 would put silver at $92/oz-164% upside with zero gold appreciation.
4. Supply Constraints: Peak Silver Production
Unlike gold, which is primarily mined for its own sake, 70% of silver is produced as a byproduct of copper, lead, and zinc mining. Base metal miners don’t increase output because silver prices rise-they dig for copper regardless.
This means silver supply is inelastic. Even at $50/oz, miners can’t easily ramp production. Meanwhile, above-ground silver stocks are depleting. The LBMA vaults hold less silver today than at any point since 2016.
When industrial demand meets inelastic supply, the silver price today becomes a coiled spring.
Gold vs Silver: The Divergence Explained
Gold and silver are divorcing. Gold tracks real rates, central bank demand, and currency debasement. Silver tracks those PLUS industrial demand, technological adoption, and supply chain stress.
| Factor | Gold | Silver |
|---|---|---|
| Primary Demand | Investment/Jewelry (90%) | Industrial (60%), Investment (40%) |
| Supply Elasticity | Moderate (price responsive) | Inelastic (byproduct metal) |
| Volatility | Low (±15% annually) | High (±35% annually) |
| 2026 Performance | +5% | +12% |
Silver is gold with leverage. When precious metals rally, silver outperforms. When industrial demand surges, silver decouples entirely. The silver price today is benefiting from both narratives simultaneously.
2026 Forecasts: The Path to $50+
| Institution | 2026 Target | Key Catalyst |
|---|---|---|
| Bank of America | $40 | Solar demand acceleration |
| Silver Institute | $38 | Industrial deficit |
| Citigroup | $45 | Investment demand return |
| Morgan Stanley | $42 | EV adoption curve |
Conservative average target: $41/oz (+17% from silver price today). Bull case (gold-silver ratio normalization): $65-92/oz.
How to Own Silver: Coins vs Bars vs ETFs
Physical (Direct Ownership):
• American Silver Eagles: $5-7 premium over spot, government guarantee, 1 oz coins
• Canadian Maples: Lower premium ($3-5), 99.99% purity, excellent liquidity
• Junk Silver (Pre-1965 US coins): No premium in crises, fractional (dimes/quarters), historic recognition
• 100 oz Bars: Lowest premium ($1-2 over spot), storage challenge, less divisible
Paper (Convenience, Counterparty Risk):
• SLV ETF: Liquid, tracks spot but has management fees and audit concerns
• PSLV (Sprott): Physically backed, stored in Canada, harder to trade
• Futures (SI): Leverage, contango/drag, not for retail
For US investors, the sweet spot is mixed: 50% physical (Maples/Eagles for liquidity, junk silver for barter scenarios) and 50% PSLV (tax-advantaged accounts).
The Bottom Line
Silver price today at $35 is not the endgame-it’s the beginning. The gold-silver ratio at 160:1 is a historical aberration that corrects through silver outperformance, not gold collapse.
The industrial demand story is structural, not cyclical. Solar and EV adoption aren’t slowing-they’re accelerating exponentially. Silver supply cannot respond quickly due to byproduct production constraints.
For American investors, silver represents the last truly asymmetric precious metals bet. Gold preserves wealth. Silver multiplies it-when the industrial and monetary narratives align.
Silver isn’t gold’s little brother. It’s gold’s leveraged, industrial, volatile twin-currently trading at the greatest discount to fair value in recorded history.
Stay stacked. Stay industrial.
Silver Price Today: Critical Questions
- What is the silver price today in USD?
Silver price today is approximately $34.87 per ounce (spot), though prices fluctuate throughout trading hours. Check the live widget above for real-time updates. - Why is silver price today so high?
Four structural drivers: solar panel demand consuming 32% of supply, EVs using 2.3 kg per vehicle, gold-silver ratio at historic 160:1 extreme (suggests massive undervaluation), and inelastic supply from byproduct mining. - Is silver better than gold right now?
Silver offers greater upside potential due to the 160:1 gold-silver ratio (historical average 50-60:1). If the ratio normalizes, silver could reach $92/oz without gold moving. However, silver is 2x more volatile than gold. - What is the gold-silver ratio?
It measures how many ounces of silver equal one ounce of gold. At 160:1, silver is historically cheap relative to gold. The ratio rarely exceeds 100:1 and typically mean-reverts through silver rallies. - How much silver should I own?
Most advisors suggest 5-10% of precious metals allocation in silver for volatility. Aggressive investors allocate 20-30% given the asymmetric setup. Physical coins (Maples/Eagles) offer best liquidity for US investors. - Will silver price today reach $50?
Multiple institutions forecast $40-45 by end of 2026. The bull case (ratio normalization + supply deficit) targets $65-92. The last time silver hit $50 was 2011 during the commodity supercycle.
KingSankalpa Protocol
Leave a Reply